GraphQL Visualizer
Data Source
About This Tool
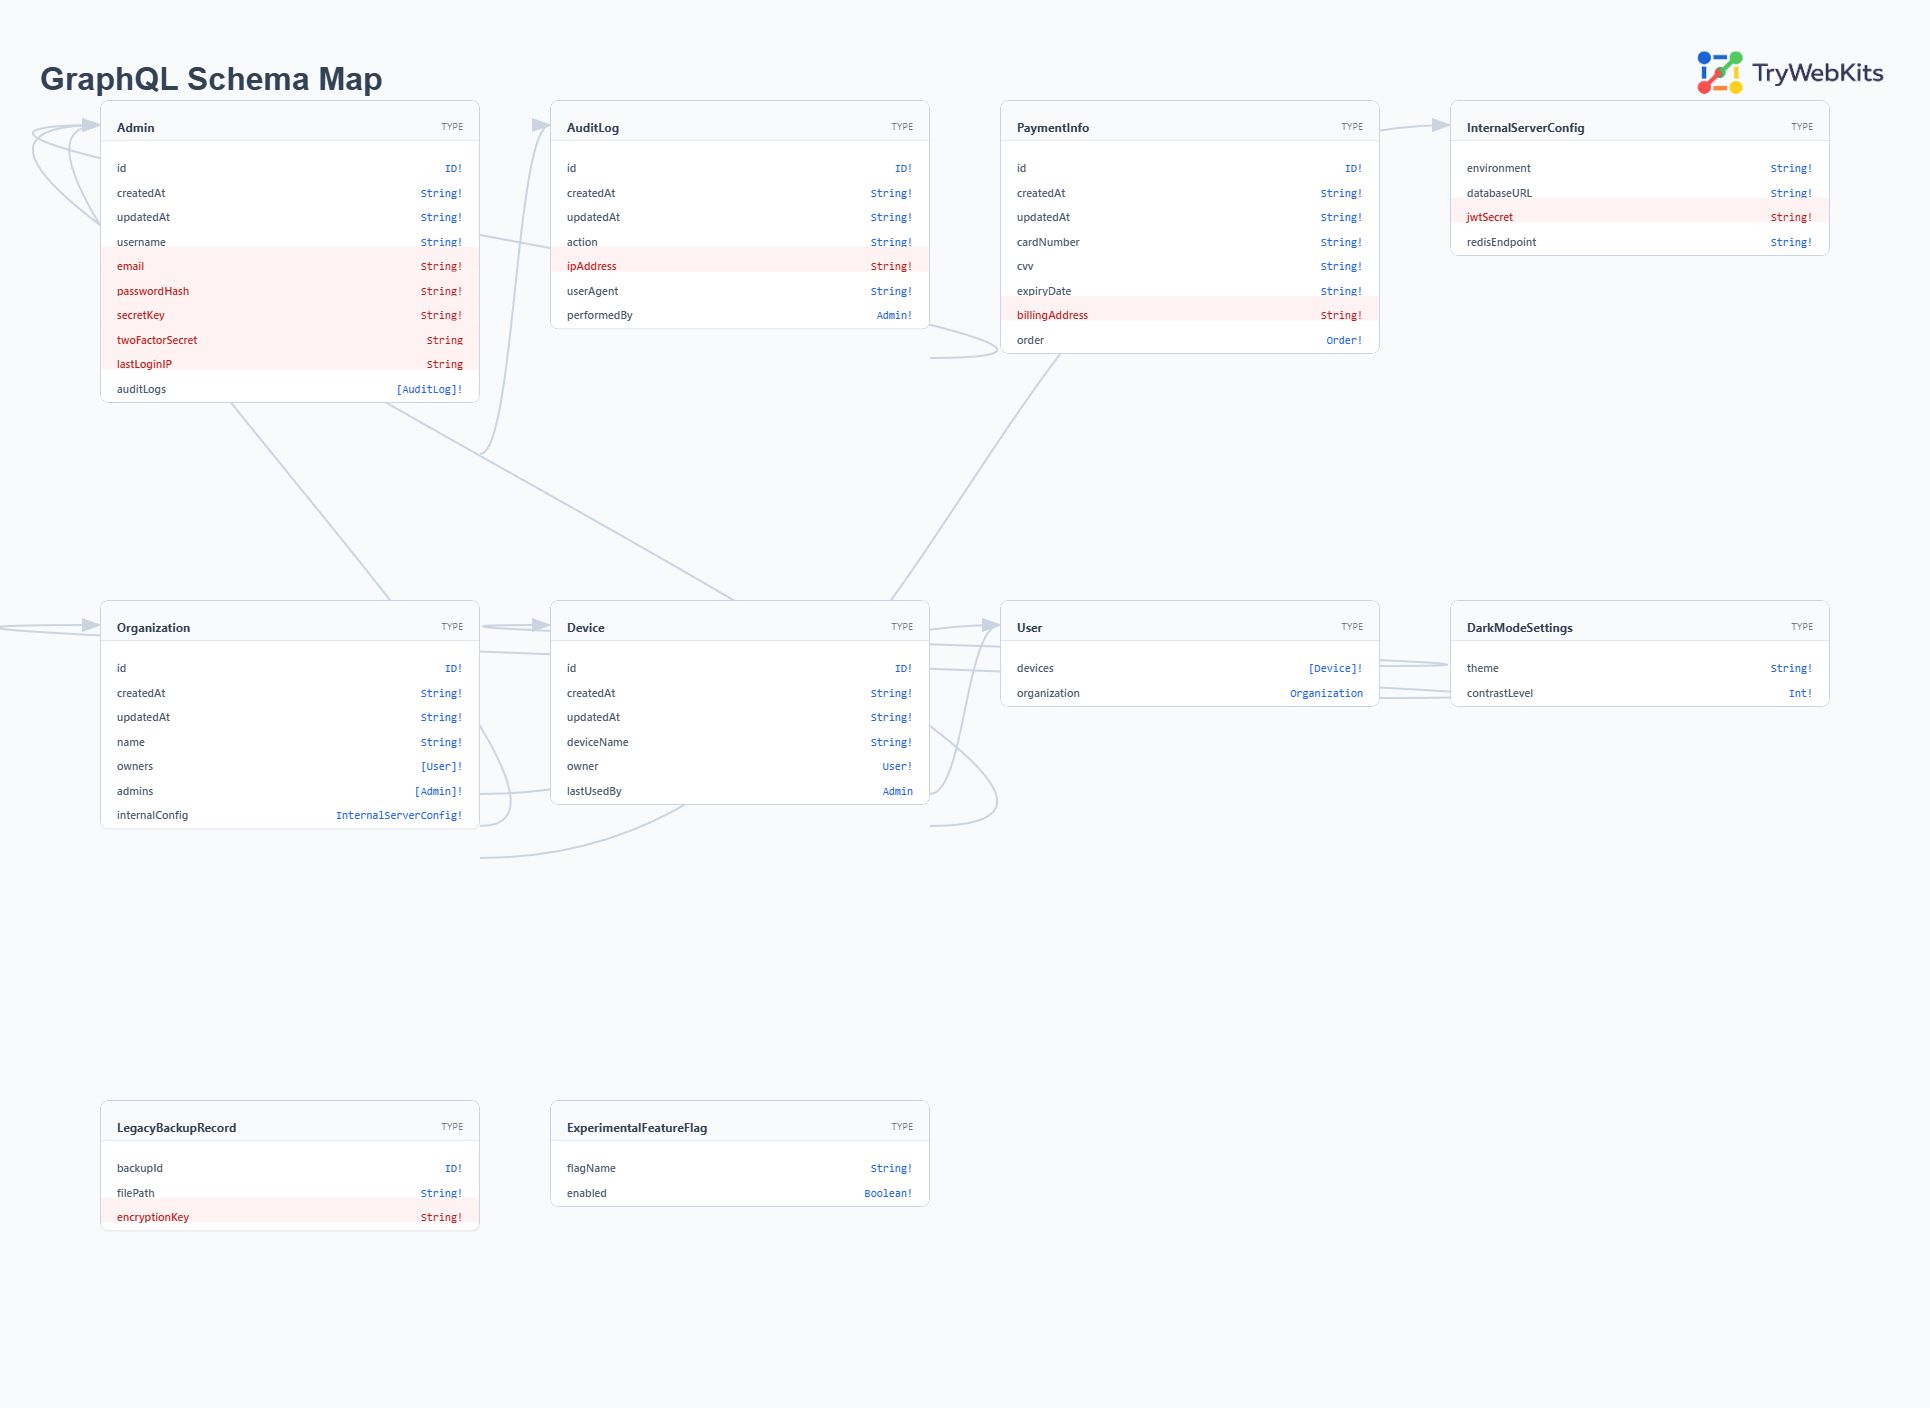
GraphQL Visualizer is a web utility that reads a GraphQL schema and shows it as a diagram. It parses Schema Definition Language (SDL) or JSON introspection results to display type definitions and relationships. This tool helps developers, engineers, pentesters, and security researchers understand API structures without reading raw code. It runs entirely in the web browser, meaning no data is sent to external servers. Use it to audit schemas, document APIs, or debug connection issues. The viewer supports large schemas with hundreds of nodes and offers high-resolution export for offline analysis.
How To Use GraphQL Visualizer and Visualize GraphQL Properly?
Follow these steps to turn your GraphQL code into a visual diagram:
- 1
Get the GraphQL schema (SDL) or run an introspection query to get JSON.
- 2
Paste the code into the input box or upload the file directly.
- 3
Click the visualize button to generate the interactive graph diagram.
- 4
Drag nodes to arrange the layout for better visibility of connections.
- 5
Use the export button to save the diagram as an image file.
Key Features
These features help when working with schemas.
Introspection Support
Visualizes JSON output from standard introspection queries for live API analysis.
Interactive Canvas
Enables moving and arranging nodes to create custom, organized schema layouts.
SDL Parsing
Reads standard Schema Definition Language text to generate visual maps.
Export Option
Saves the generated graph as a high-quality image file for documentation.
Search Functionality
Locates specific types or fields quickly within massive, complex data structures.
Type Mapping
Highlights connections between different data entities to reveal architectural relationships clearly.
Why Use Our Tool?
This tool provides a visual approach that shows the complete data graph in one view.
PII Detection
Scans field names and descriptions to flag potential personally identifiable information in the schema.
1000+ Node Support
Renders schemas with over 1000 nodes without slowing down the browser or losing detail.
Introspection Helper
Provides the exact query needed to fetch schemas from live endpoints for quick analysis.
Smart Layouts
Automatically arranges complex entity relationships into a readable, organized grid structure for clarity.
Frequently Asked Questions (FAQs)
SDL is the readable schema format written in GraphQL syntax. Introspection JSON is the raw response from an introspection query.
The tool scans field names and descriptions for patterns matching emails, addresses, phone numbers, and government IDs. It highlights these fields in the diagram.
The layout algorithm places connected types near each other. Circular references appear as mutual connections that users can trace by following the edges.
This usually happens if there are syntax errors or broken references in your input code.